For my public relations class I created an infographic for the 2013 MTV Video Music Awards. I was interested in creating an infographic on this awards show because while watching the live show, MTV interacted on social media before, during and after the awards show. I was able to follow and interact with the show on multiple social platforms including Instagram and Twitter. By using the #VMAs hashtag, I was able to follow specific conversations on social media and follow celebrities as they enter the red carpet. I was excited to make this infographic, and I changed my mind several times about how I wanted to present it. Here are a few tips to making an infographic easier from the start.
Do your research first: It was helpful to understand and know all the statistics about my topic before starting the infographic. I was able to organize the content and have a vision of what I wanted while researching and finding facts.
Check out some examples: I looked at infographic examples online before and during the process of making it. It was helpful to get some ideas about what works and doesn’t work. Even if the topic isn’t the same as yours, how the content is organized and presented can still be helpful in designing your own infographic.
Think about the visual and creative side: While researching and finding statistics, I would think how I could make the data visually interesting. I wanted the infographic to be both informative and creative.
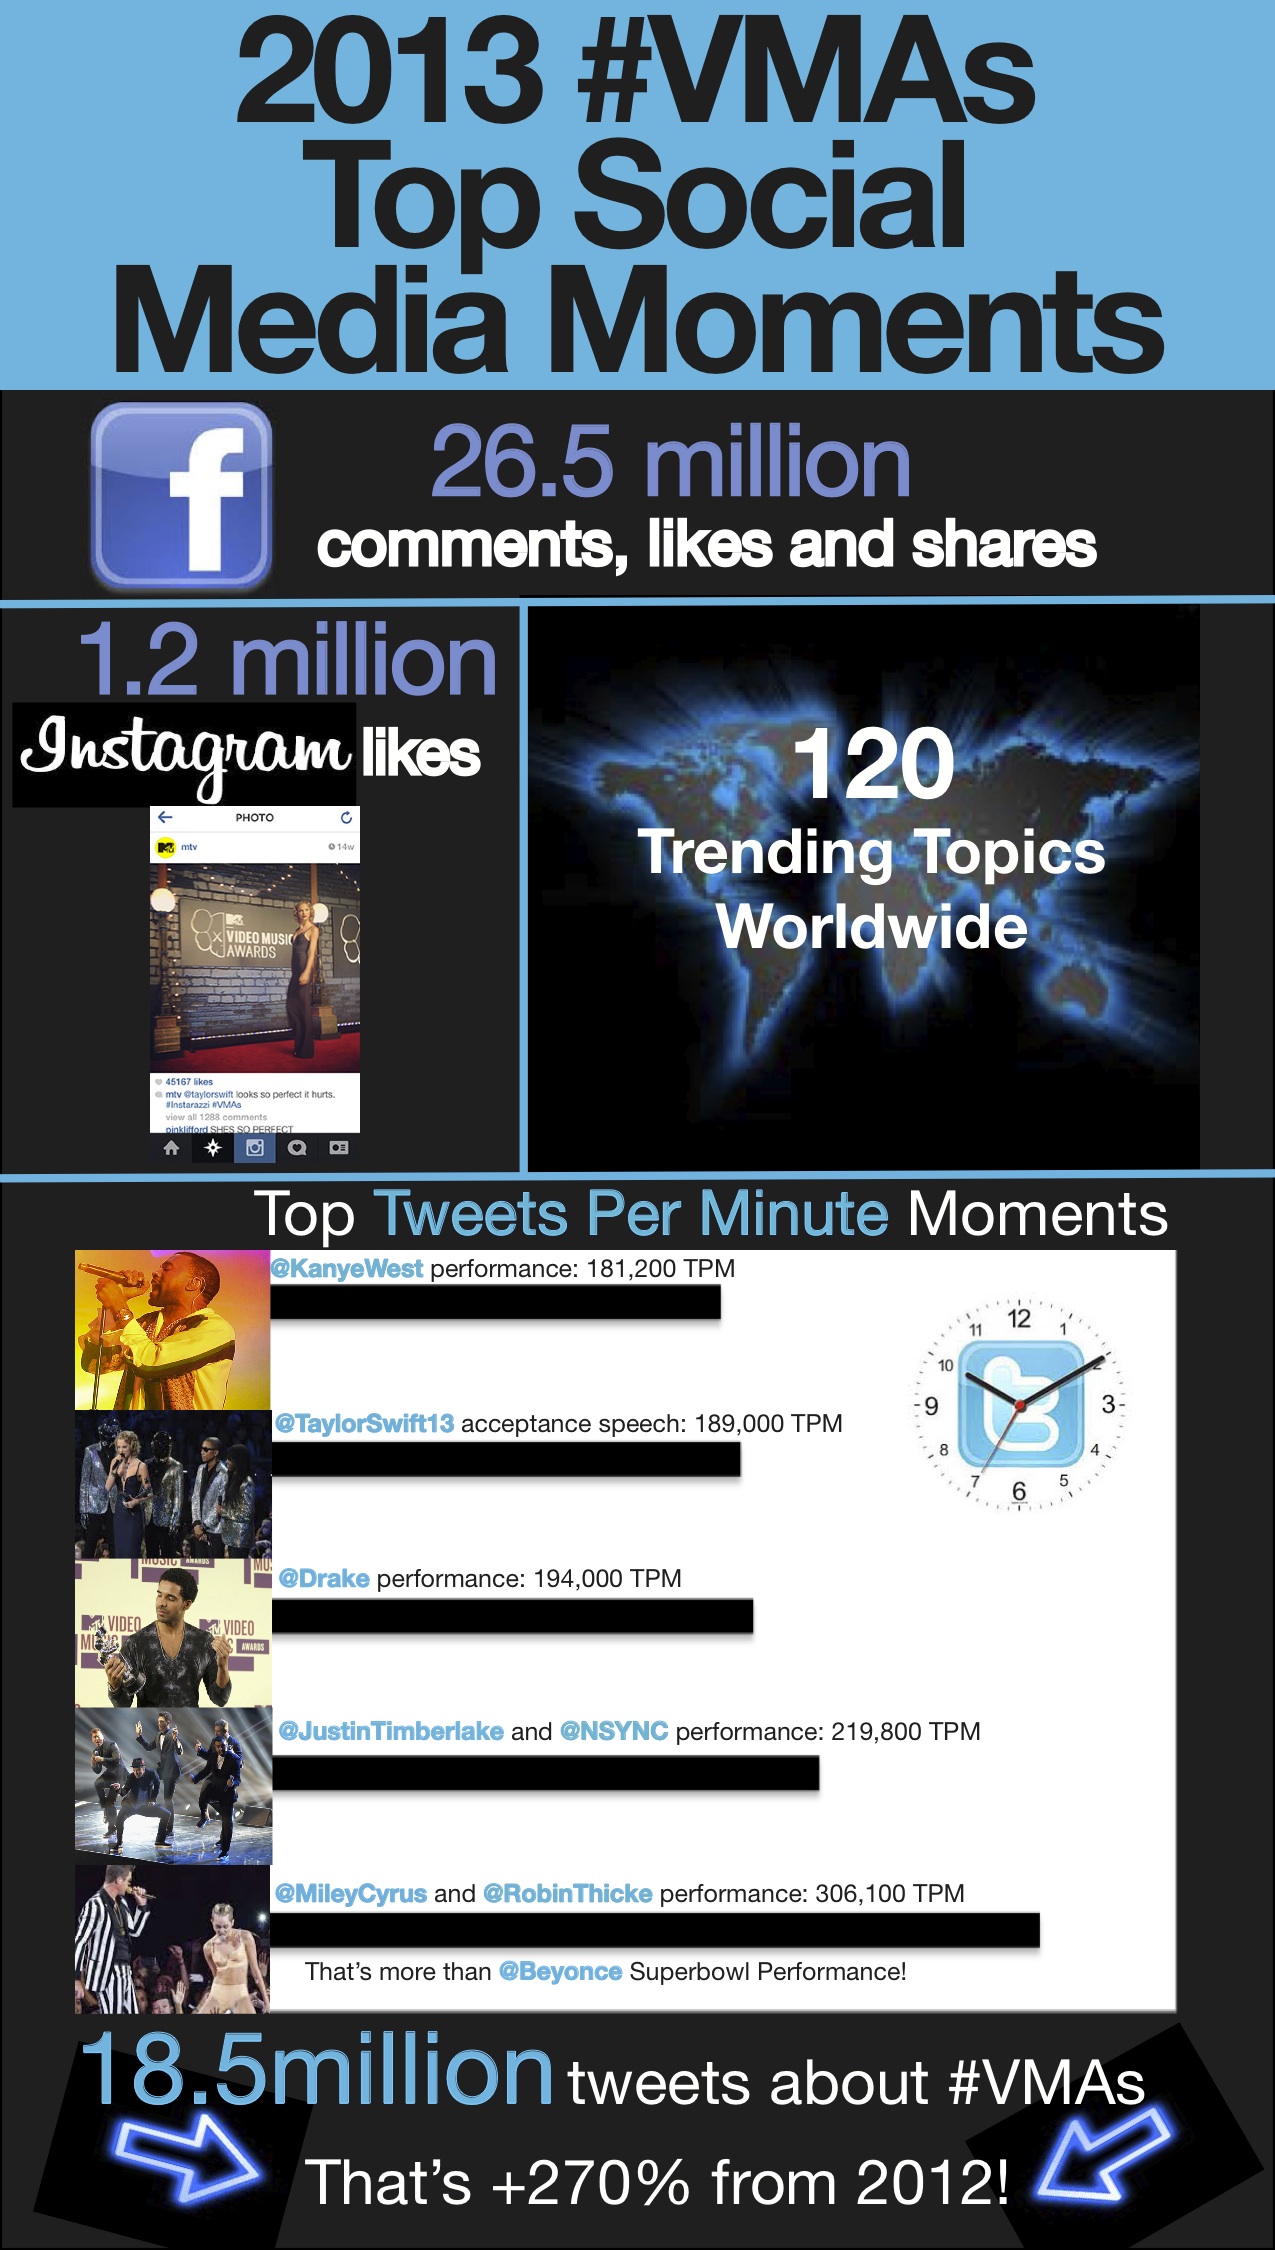
View my infographic below: